archive / 2009–2013
A "Visual, Analytic Storefront"? Vay-ner-chuk WineLibrary Style!
[twitter float="right" size="medium" text="Data viz mash-up of @WineLibrary wine data & @garyvee's WineLibraryTV vids w #tableau - built by @ryrobes" style="vertical"]Interactive Data Analysis (and all forms of its buzzword-laden cousins) is pretty much blowing up these days. It seems that even Gartner in 2012 is bullish about Business Intelligence, and visual analysis goes hand-in-hand with it, if you ask me. I do a lot of standard (yet innovative, I think) reports and visualizations at my day-job, but I'm always looking for cool new ways to leverage this shiz and push the ball downfield with the tools I have available. After seeing how people dug my Bigfoot, UFO and Metallica vizes - I racked my brain to figure out what would be a cool data set to mine, mash-up and present in an interesting and "forward-thinking" type way. Being a huge WineLibrary TV and @garyvee fan, this just seemed inevitable... The result? WineLibrary's reachable web catalog (5,625 wines) crossed with Gary's WLTV Reviews and some other cool surprises. [box type="note" style="rounded" border="full" icon="../uploads/2012/04/garyhead.jpg" ][typography color="black" font="Segoe UI" size="14"] How this works: filter the wine list by Country, Availability, WineLibraryTV Review, etc, click on the wine name and then go down below to see the details (and some sweet videos, lots of 'em).[/typography][/box]
So go ahead, scroll down, click on some wines, maybe even learn something...
(Note: I defaulted the filters to YES they were on "The Thunder Show" and YES they are STILL for sale at WineLibrary, cleaning them will unfilter thousands of others. The older stuff gets, the harder it is find - wine can be funny like that)
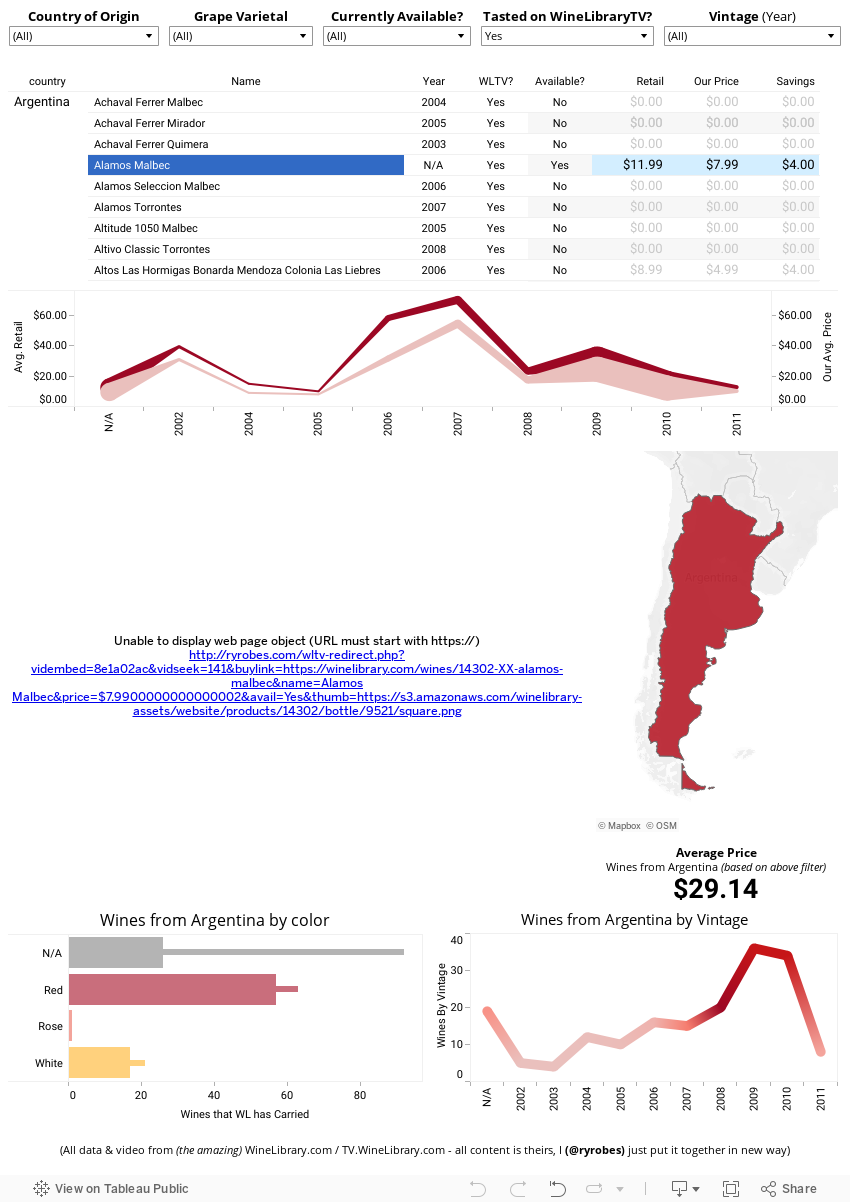
I can't tell you how long I've spent clicking around and watching the wine reviews on different particular wines - even though I've seen 90% of these episodes before (been a big fan for quite awhile) - its just a different presentation and interaction experience. More? Scatter Chart Value Play!
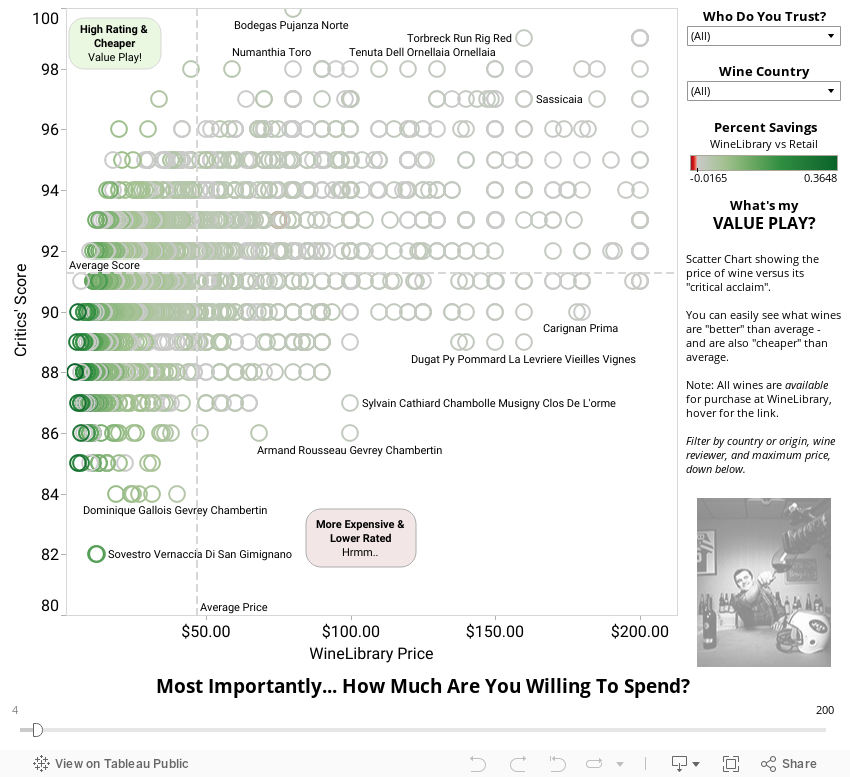
Maybe "Analytics Storefront" is a bit of a stretch, but I can see it being some interesting info-tainment when executed properly, hell, Amazon is already doing stuff like this - but they are "big time". Now, if you were a mid-size retail company... combining this kind of data + website hit and bounce data + store POS / costing info would create one hell of an operational dashboard and visual analysis system. Data is a big part of the game. What's better than regular old data? Easy to understand ACTIONABLE data. Screw Excel, Crystal Reports, and your current "system". Think Next-Level-Shit. [box type="info"]Have data integration, data transformation, visual analytics needs? Hit me up! Mad data skills, a bizdev sensibility, a flair for "informational art".[/box] Hope you enjoyed it and big respect to WineLibray and Gary Vaynerchuk for building such an empire that I can analyze. :)
Dig this? Check out some of my other "out of the box" data visualizations / dashboards
[threecol_one] 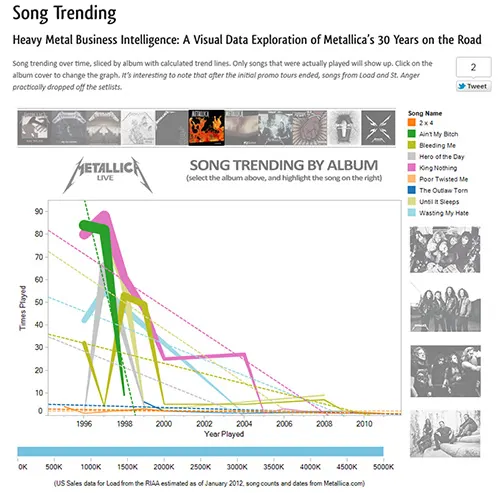
Metallica Tour Visualizations
Lots of them. Lots. Even if you aren't a fan - it makes an interesting BI Dashboard POC.
[/threecol_one]
[threecol_one] 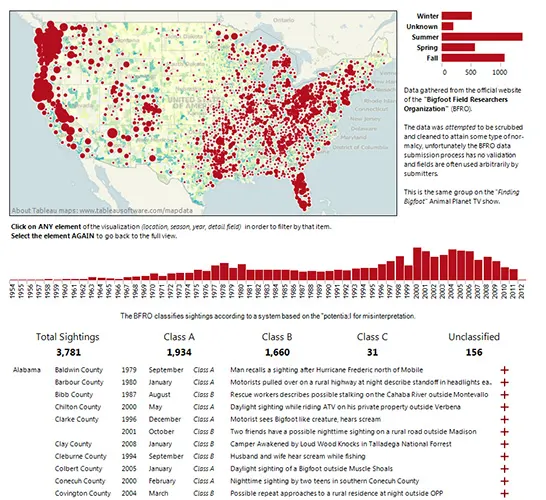
Bigfoot Sightings in the US
Beware. The Squatch is among us. Cool example of web "data mining" and re-displaying in a radically different format.
[/threecol_one]
[threecol_one_last] 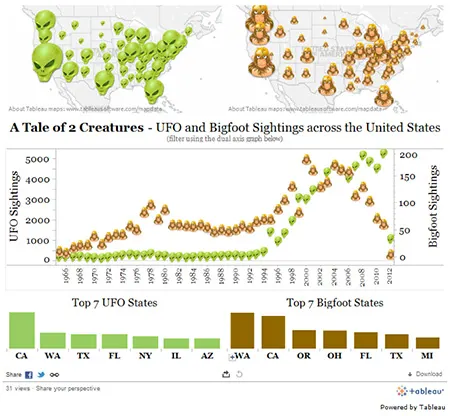
Bigfoot vs UFO Sightings!
Oh noes, who KNEW there were so many mythical threats out there? Or are they. OR ARE THEY!? [/threecol_one_last]