work / 2018–
DataRabbit
Began as Rabbit, an internal data tool I built at Facebook (2015–17). Rebuilt from 2018 as a live-coding canvas. Now the SQL and operations console in the Calliope stack.
First as "kits" of EDN maps (apps = data), then a river of REPLs — server CLJ blocks and client CLJS blocks passing values on a canvas. Alpha 1, Aug 2022. reClojure 2022 talk: "A system built for seeing." Evolved into RVBBIT rather than ending.
Origin: Rabbit at Facebook, 2015–2017
DataRabbit started inside Facebook. In 2015, while working in central BI, I built a prototype data tool called Rabbit. The earliest screen recording in my archive is from August 2015. The first pitch deck, from December 2015, called it "a new way to work with data at FB. Exploration is understanding."
Rabbit was meant to be one tool for the whole loop: search, quick exploration, visualization, dashboards and storytelling, then embedding the results in other internal apps. A 2016 deck split it into an Explorer (find, query, visualize, experiment) and a Composer (arrange, explain, filter, present, embed). You built charts by dragging fields into place or by live-coding open JavaScript visualizations. A March 2017 tech talk described it as an integrated tool for exploring data sources and for building and sharing JavaScript visualizations and dashboards in React. It could use any chart library (D3, Highcharts, Plotly), and a chart could be embedded with one line of code.
Both patents came out of this work. The 2016 filing describes Rabbit's core idea: one access layer over many data sources, a live workspace where charts update as you edit, and generated chart code you can edit by hand. The 2017 filing, on ranking chart templates to suggest visualizations, matches an item on Rabbit's feature checklist: "graph type suggestions based on query being built."
Rabbit got a dedicated team. After a large reorganization it was absorbed into another team, and it was eventually shut down. I kept working on the same set of problems, and DataRabbit is where that led. It shares little with the original beyond the idea.
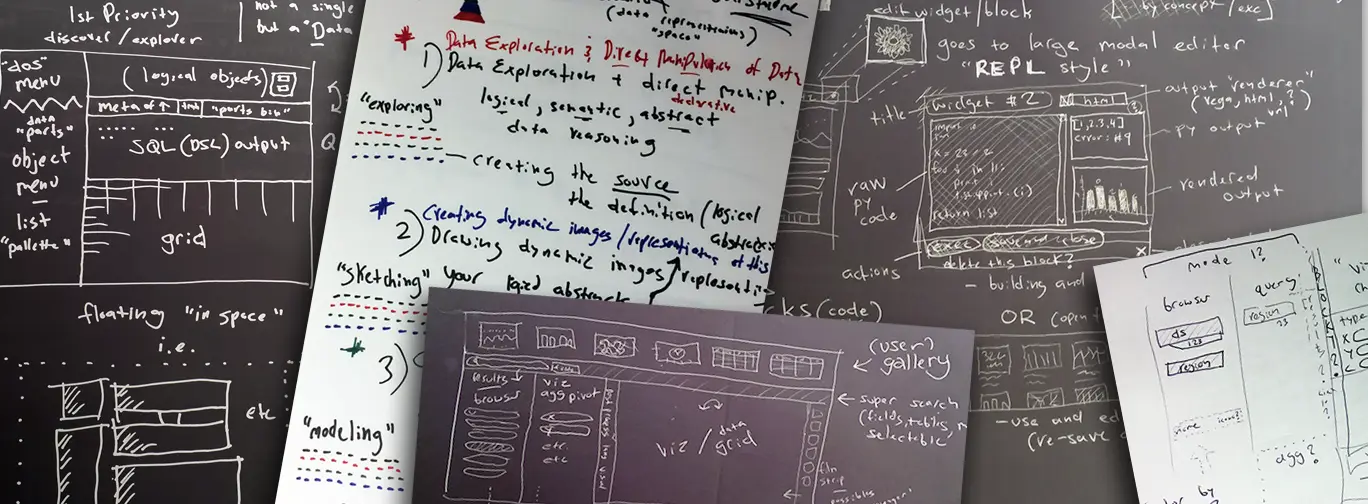
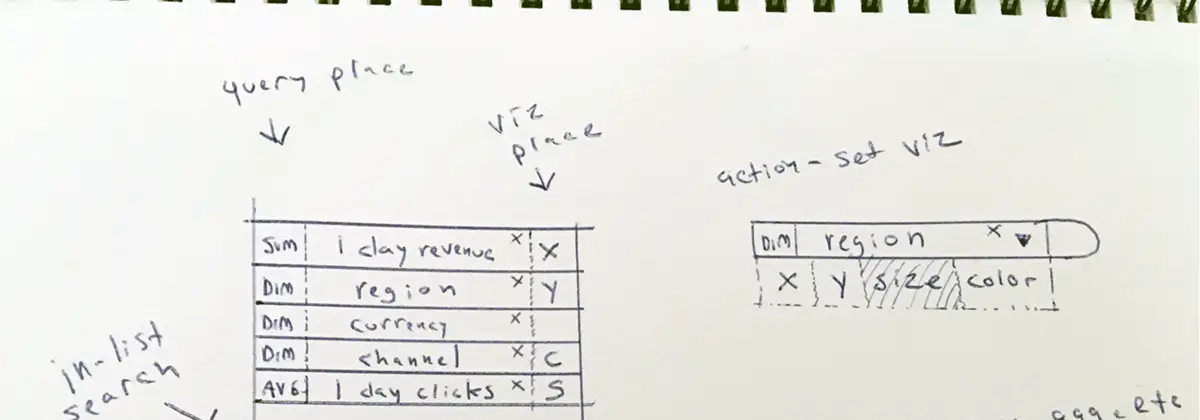
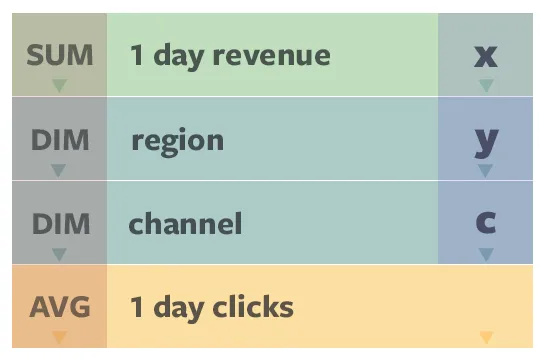
Sources: Ryan's own Rabbit decks (Dec 2015 – Nov 2017), design files, notes, and his 2020 post. That post and Ryan himself are the sources for the reorg and the shutdown.
Timeline
- Apps as pretty-printed EDN Screw an internal DB for the alpha. Rabbit apps = readable, diffable maps.
- August of the Rabbit Back to blogging after the corpo years. Five ideas for a data tool: don't shelter complexity, two-handed UI, close to the metal, high creative ceiling, hackable by design.
- Pseudo-isometric z-index Sometimes the best UI is UI that also doubles as a data viz.
- Editing the editor User-space extending of the UX. Flying the plane while fixing it.
- Hire me (the first time) Remote Data Eng, custom Data UIs, enterprise dashboarding, ClojureScript. Artistic resume and a corporate one, because artful resumes aren't always well received.
- Experiments — igel ML UI End-to-end UI for a Python ML CLI. Observability and feedback-loop ideas borrowed from Bret Victor.
- Hybrid front/back live-coding DAG Same language for user-space components and server data flows. Chefs kiss.
- Notebook, dashboard, flow IDE? Hybrid of all of the above. Flow editor canvas, weird test flows.
- River of REPLs Blocks are dumb — they eval themselves and send the return. JDBC "select *" blocks, Under Siege-themed UI tests, dogfooding the server monitor in Rabbit.
- Dec 31st — Alpha 1. (finally) A flow-based local Clojure(Script) mega-REPL notebook map. AS IF.
- Kill your darlings Prefab blocks → river of REPLs. The lifeblood is the flow of data through simple components.
- Context-heavy UI So much going on. Still not sure what to call it, categorically. JAR soon — I swear.
- Data Rabbit Alpha 1 Flow-based live-coding REPL canvas. Elevator pitch still a work in progress. 5.3k on YouTube.
- nREPLs, SQL, JDBC, Vega The Clojure-flavored sibling of the cljs-only intro.
- Alpha 3 — Python and R in the flow Custom server blocks, still native to a Clojure flow. Curiouser and curiouser.
- reClojure 2022 — A system built for seeing Through the looking glass with Data Rabbit.
- reClojure talk, Twitter cut A System Built for Seeing — ~25 min version, with the video attached. 108 likes.
- Stream block Backend accepts arbitrary HTTP JSON POST. Write a small filter fn; matching events become canvas blocks.
Sources: calliope README; timeline.yaml; ~/fb-backup Rabbit decks/design files; 2020 blog post